Sublime
An inspiration engine for ideas

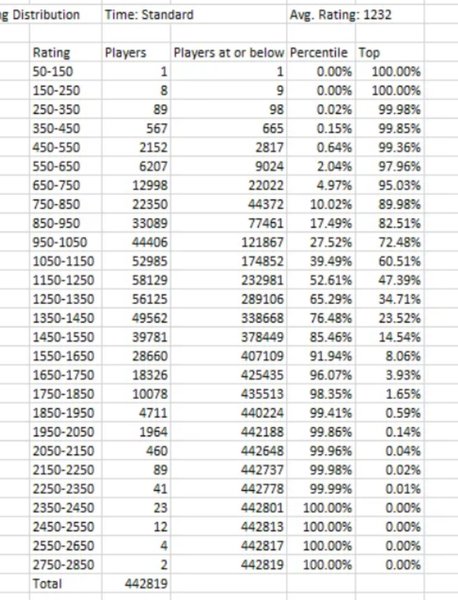
Comparisons are one of the most basic and useful things we do with charts.
Scott Berinato • Good Charts
Graphs
Alya Jasmine • 2 cards
Visualizations
ian ross • 1 card
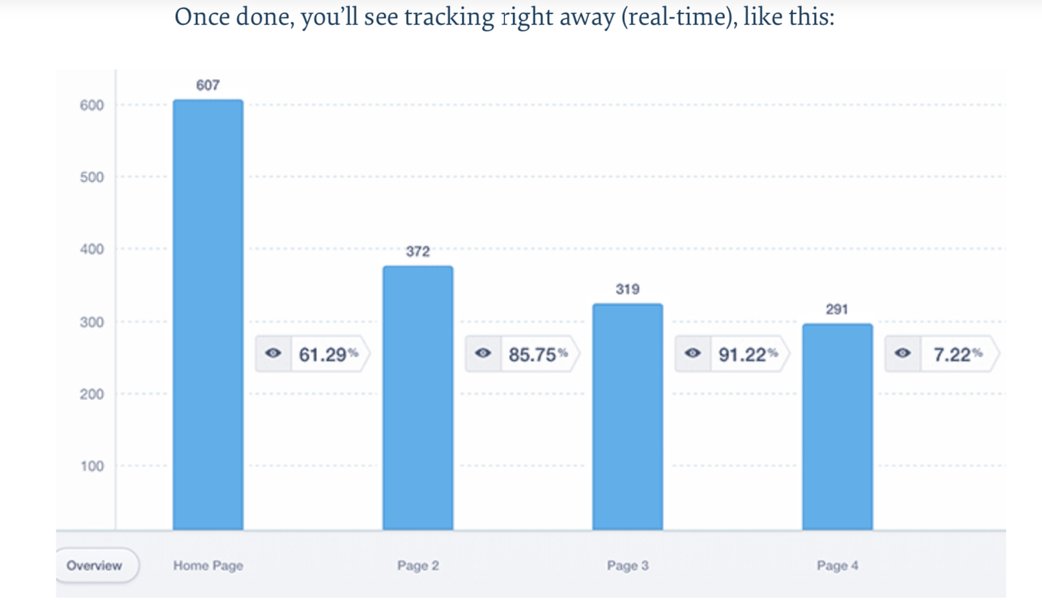
CRIT 2 Here’s one presented without commentary. The original chart:
Scott Berinato • Good Charts
Graphs and Charts
This is a collection of graphs and charts I can use for analysis
Leo Guinan • 1 card