Sublime
An inspiration engine for ideas


A good chart in that context would reflect multiple future scenarios, as seen on this Revenue Projections chart:
Scott Berinato • Good Charts
In your list, you should see a handful of themes start to emerge and the value those features deliver to customers. Now we need to organize the list. To group points of value, you need to take the perspective of a customer. What points would naturally be related in the minds of your customers and prospects? For example, if you have attributes like
... See moreApril Dunford • Obviously Awesome: How to Nail Product Positioning so Customers Get It, Buy It, Love It
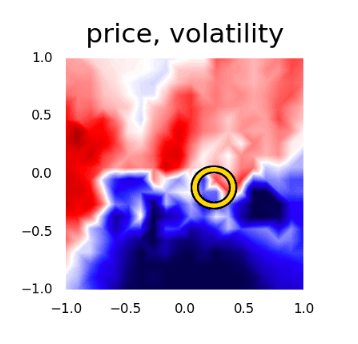
When you
1. segment a stock's time-series into a "price" (up, down) and "volatility" (rising, falling) component, and then
2. plot each of those on an axis, and then
3. color the coordinates according to forward returns at each of the [x, y] coordinates... https://t.co/kfFbEfsNko
Data Visualization
Nicolay Gerold • 5 cards
Data Visualisation
Eliane • 3 cards
Figure 3.15 Original graph
Cole Nussbaumer Knaflic • Storytelling With Data
as individuals, draw the most important graph about your problem, and accompany it with a few words (spoken or written) describing its significance.