Sublime
An inspiration engine for ideas

When I hear the word “distribution,” I imagine a histogram showing the frequency of occurrences of a given event.
Roman Zykov • Roman's Data Science: How to monetize your data
According to the central limit theorem, proven in 1810 by Pierre-Simon Laplace, any such random process—one that amounts to a sum of a large number of coin flips—will lead to the same probability distribution, called the normal distribution (or bell-shaped curve). The Galton board is simply a visual demonstration of Laplace’s theorem.
Dana Mackenzie • The Book of Why: The New Science of Cause and Effect
Testing for Normality: 164 (Statistics a Series of Textbooks and Monographs)
amazon.com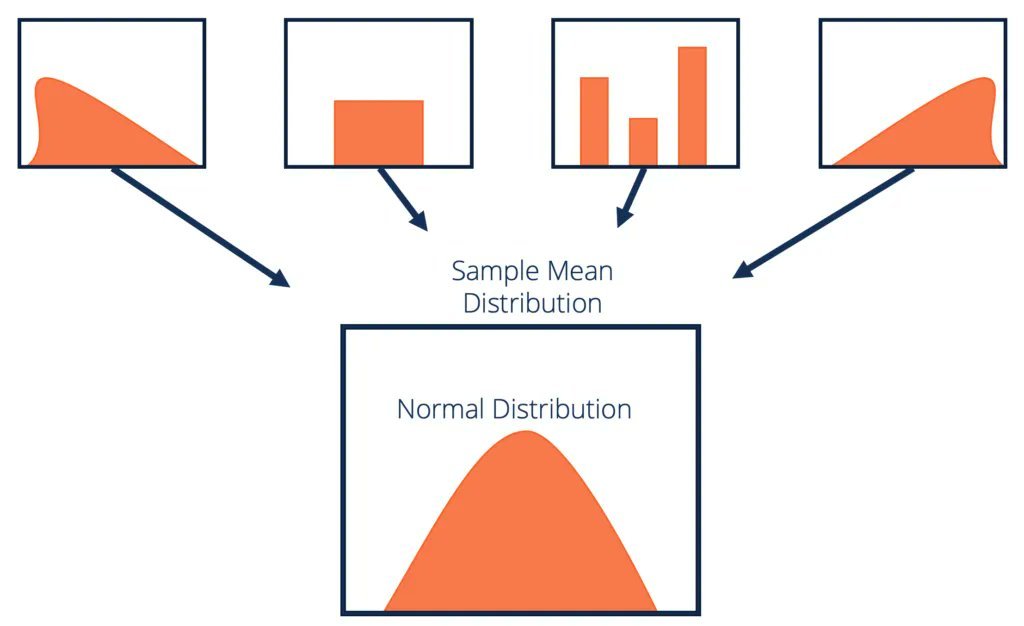
He knows, through a quite involved calculation, that at some point in a series of two hundred coin-flips, either heads or tails will come up six or more times in
Thomas H. Davenport • Keeping Up with the Quants: Your Guide to Understanding and Using Analytics
there's variation in all things; variation creates uncertainty; and probability and statistics are tools to help us manage uncertainty.
Jordan Goldmeier • Becoming a Data Head
Mathematics
Frank Hecker • 2 cards
Think of it this way. In a bell curve type of situation, like displaying the distribution of height or weight in a human population, there are outliers on the spectrum of possibility, but the outliers have a fairly well-defined scope. You’ll never meet a man who is ten times the size of an average man. But in a curve with fat tails, like wealth,
... See more