Sublime
An inspiration engine for ideas

If we understand the world through just-in-time visual queries, the goal of information design must be to design displays so that visual queries are processed both rapidly and correctly for every important cognitive task the display is intended to support.
Colin Ware • Visual Thinking: for Design (Morgan Kaufmann Series in Interactive Technologies)

Data Visualization
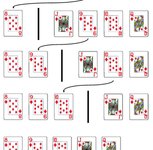
dane cads and • 12 cards

