Saved by phoebe and 41 others
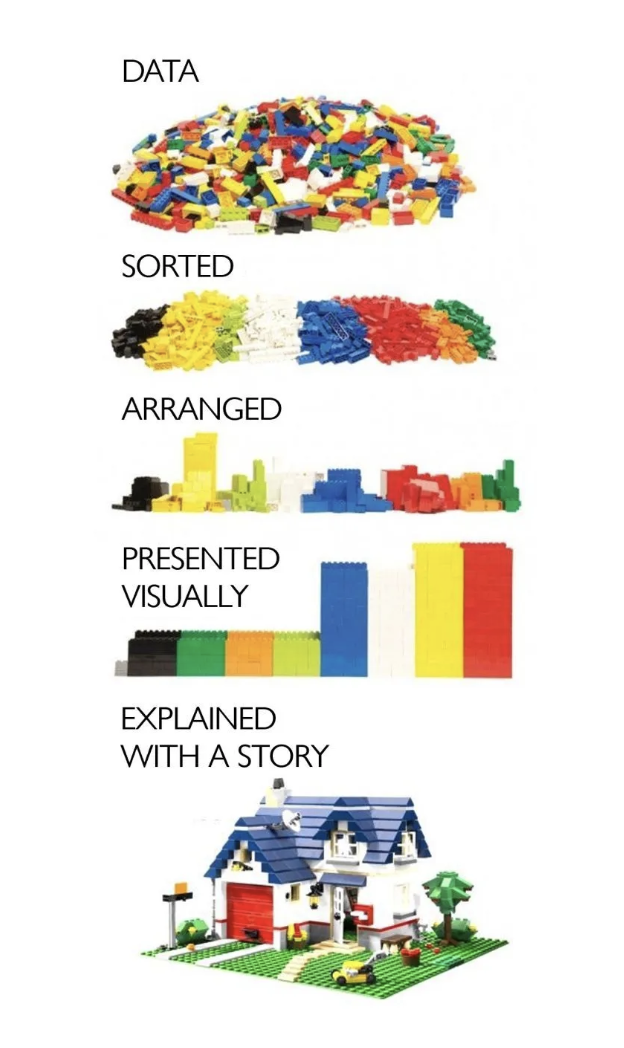
This approach, used by such companies as Narrative Sciences and Automated Insights, creates a story