Sublime
An inspiration engine for ideas
I like to think of data visualization as a story. The main character is the user, and we can go two ways. A story of charts and graphs might read a lot like a textbook; however, a story with context, relationships, interactions, patterns, and explanations reads like a novel.
Jeff Hammerbacher • Beautiful Data: The Stories Behind Elegant Data Solutions


Write an essay. Make a quick video with a customer. Use a motion chart (http://zqi.me/mcharts). Be unböring.
Avinash Kaushik • Web Analytics 2.0: The Art of Online Accountability and Science of Customer Centricity

Easily pulls accurate data from any source
April Dunford • Sales Pitch: How to Craft a Story to Stand Out and Win
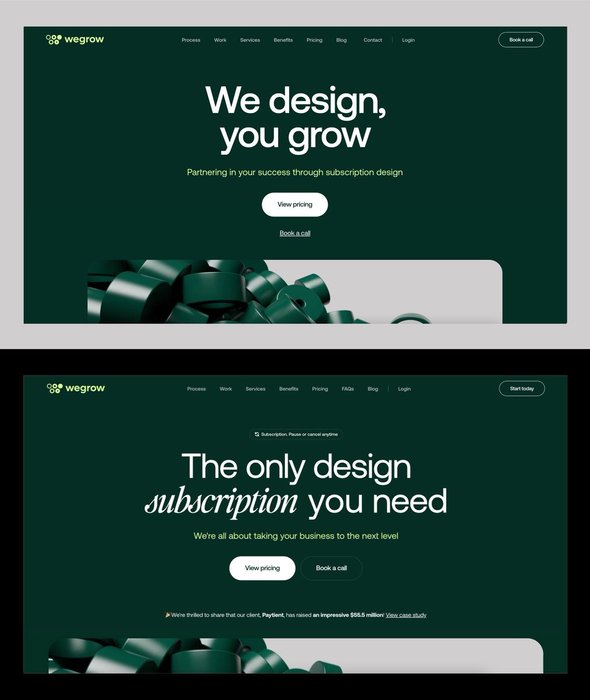
Which hero will perform better?
A beautiful design alone isn’t enough; you need data. We recently collaborated with a marketing specialist at https://t.co/cUKuCzVrdO . We provided design services, and they offered marketing expertise (love this kind of collaboration!).
We tested the... See more
The growth model for this imaginary app runs from bottom left to top right. The boxes represent absolute numbers: the number of website visitors, conversions, and churned users. The arrows represent conversion percentages, like the conversion rate from visitor to trial user.