technical analysis
Technical Indicators: Barchart.com Education
barchart.com
Percentage Price Oscillator
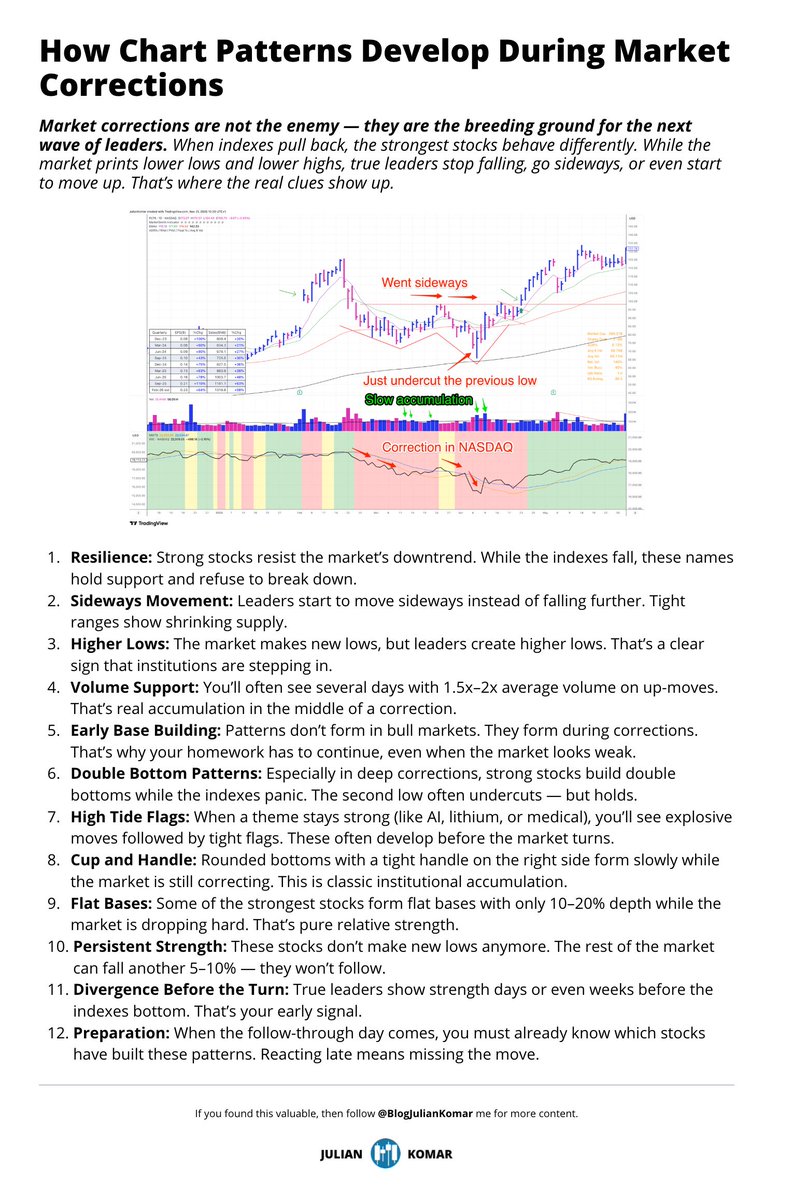
If you only study charts in uptrends, you’ll always be too late. 😱
This page shows you exactly how real leaders build their patterns during market corrections — so you know what to follow when the market finally turns. 👇 https://t.co/JSBWNL2fqt
The exam could have you figure alpha based on beta. For example, let’s say an investment has a return of 8% and a beta of 1.5. The benchmark is the S&P 500, which was up 6% over the period. Because 8% is higher than 6%, this was a good investment, right? Well, a beta of 1.5 implies a volatility that is 50% greater than the benchmark. If the
... See moreRobert Walker • Pass The 65: A PLAIN ENGLISH EXPLANATION TO HELP YOU PASS THE SERIES 65 EXAM - UPDATED FOR 2017

Market Wizard Linda Reschke's 12 Technical Trading Rules: @SJosephBurns
1. Buy the first pullback after a new high. Sell the first rally after a new low.
2. Afternoon strength or weakness should have follow through the next day.
3. The best trading... See more
Moving Average Cheat Sheet:
• 5 EMA : ⚡ Momentum
• 10 EMA: 🔍 Short-term trend
• 20 EMA: 🎯 Mean reversion
• 50 SMA: 🛡️ Strong uptrend support
• 100 SMA: 📉 Dip buy alert
• 200 SMA: 🔄 Trend shift
• 250 SMA: 💰... See more
Deniz The Traderx.com
Market Wizard Linda Reschke's 12 Technical Trading Rules: @SJosephBurns
1. Buy the first pullback after a new high. Sell the first rally after a new low.
2. Afternoon strength or weakness should have follow through the next day.
3. The best trading... See more
Linda Reschke's 12 Technical Trading Rules
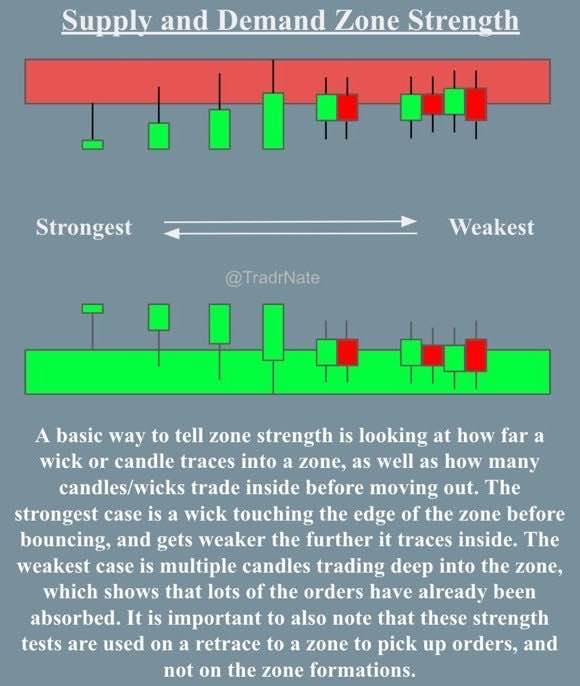
One of the best graphics in the world🌎
How to determine the strength of key levels https://t.co/dfmExI2DCw
For daily data, longer moving averages might be preferred to filter out some of the randomness associated with daily prices. For weekly data, which will have already filtered out some of the randomness, shorter moving averages may be deemed more appropriate