Data Visualisation
Cytoscape.js
js.cytoscape.org
Graph network visualisation library.
Data Visualization for Machine Learning in Elixir | zacksiri.dev
zacksiri.dev
1 dataset. 100 visualizations.
100.datavizproject.com
Announcing Observable 2.0
observablehq.com
Software Carpentry: D3 - Paths
emilydolson.github.io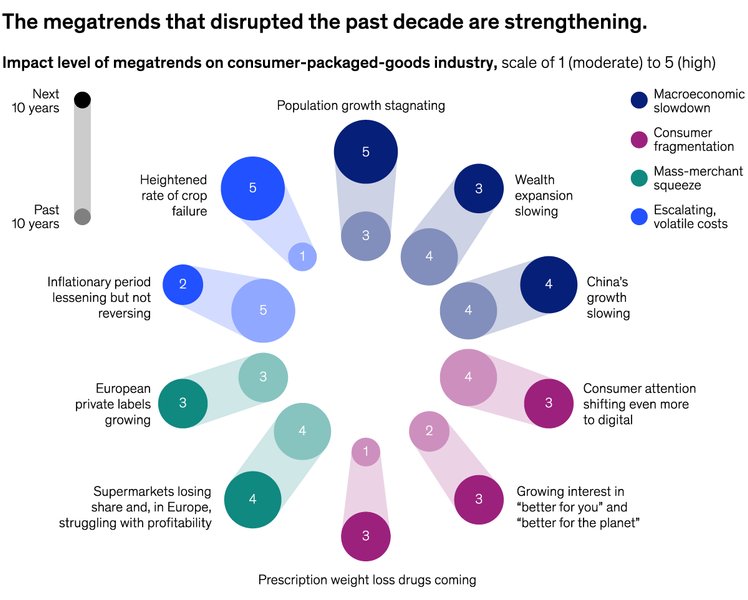
Is this a more interesting way of showing change than, for example, an equivalent bar chart?
Home - Graphistry
graphistry.com
Data Viz Project
datavizproject.com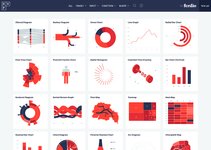
Circos is a software package for visualizing data and information. It visualizes data in a circular layout — this makes Circos ideal for exploring relationships between objects or positions. There are other reasons why a circular layout is advantageous, not the least being the fact that it is attractive.