what's so stunning about this chart of annual US births (millions, blue columns) and fertility (children per childbearing female, black line) is that previous peaks in the economy and asset markets moved together w/ births/fertility into '80, '90, '00, '07...but since '07 the https://t.co/l6HwOK97jY
what's so stunning about this chart of annual US births (millions, blue columns) and fertility (children per childbearing female, black line) is that previous peaks in the economy and asset markets moved together w/ births/fertility into '80, '90, '00, '07...but since '07 the https://t.co/l6HwOK97jY


fertility drops much below 2.1 babies per woman, the population will shrink unless offset by immigration.
Greg Ip • The Little Book of Economics: How the Economy Works in the Real World (Little Books. Big Profits)
Charted: The Global Decline of Fertility Rates
visualcapitalist.com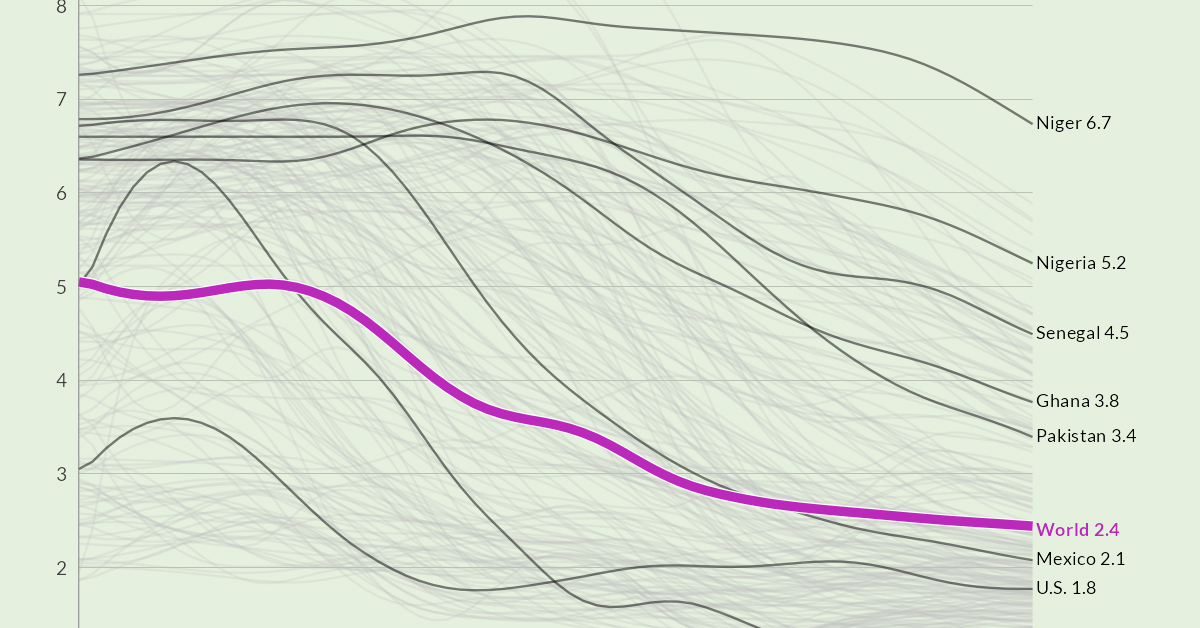
Our time horizons too are contracting. Young Americans are deferring or canceling their aspirations. Over the last decade, we have witnessed a declining birth rate and falling home ownership among young adults—and fewer business start-ups either by or for young adults.