Saved by Kalyani Tupkary
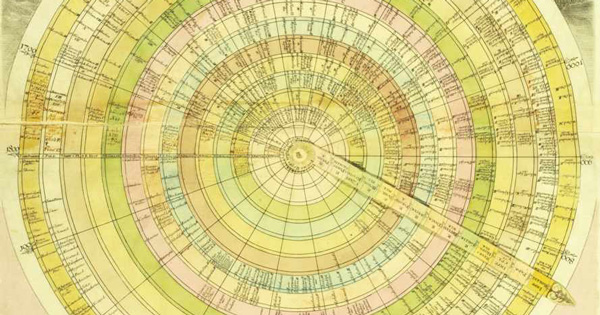
Cartographies of Time: A Visual History of the Timeline
Saved by Kalyani Tupkary
Time, and how we experience time, is always a cultural creation. Most cultures are taught—to put this very simply—that time is circular. Subsequently, you can see the world being played out in a circular way. What’s interesting about Western cultures is, at some point, we said, “You know what? We’re not circular. We’re an arrow. We’re not looking
... See more