Sublime
An inspiration engine for ideas

Charts with React Native!
The recording below is an example of what's possible using the VictoryNative graph library in combination with RN Skia, reanimated, and gesture handler. https://t.co/3iD0V59sDd
Brandon Austinx.com
Just a moment...
codepen.io
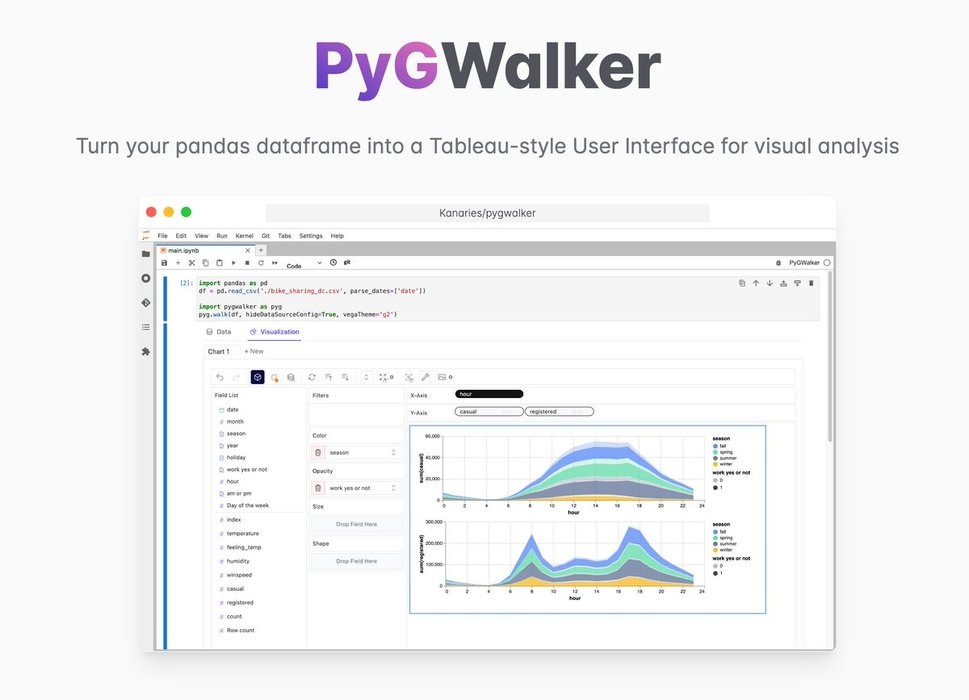
Tableau is $800 per year.
PyGWalker is $0.
It turns your pandas DataFrame into a Tableau dashboard.
• Launch from Jupyter Notebook
• Tableau-like visualizations
• Run in Kaggle and Colab
Get the code on... See more

D3 by Observable | The JavaScript library for bespoke data visualizationGitHubTwitterMastodonSlackLinkedInYouTubeGitHubTwitterMastodonSlackLinkedInYouTube
d3js.org

