Sublime
An inspiration engine for ideas
Perspective | Perspective
perspective.finos.org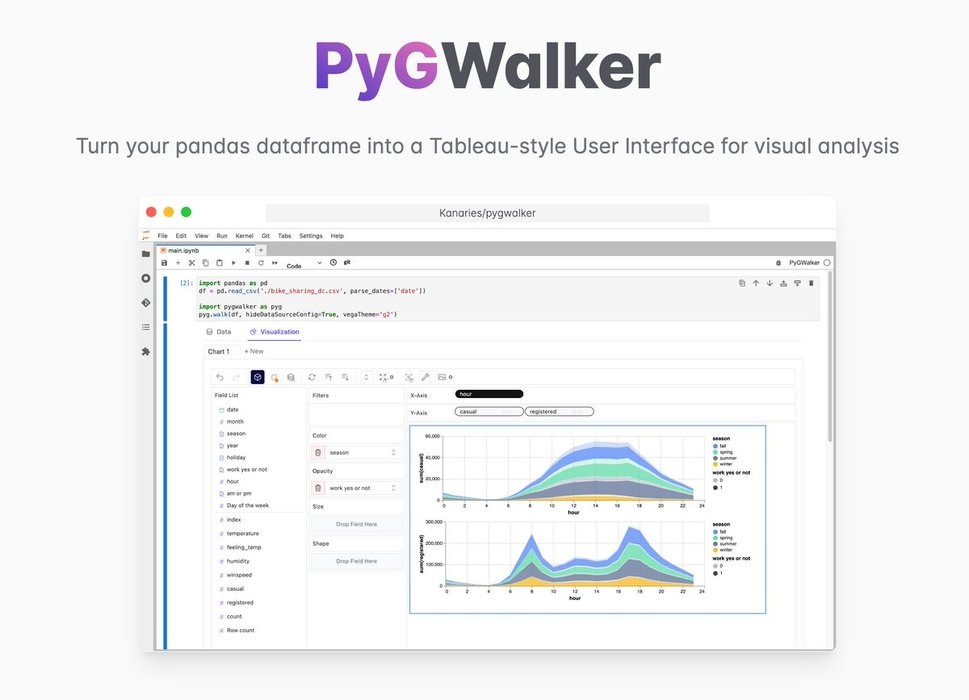
Tableau is $800 per year.
PyGWalker is $0.
It turns your pandas DataFrame into a Tableau dashboard.
• Launch from Jupyter Notebook
• Tableau-like visualizations
• Run in Kaggle and Colab
Get the code on... See more

Where data teams go deeper, faster | Observable
observablehq.com

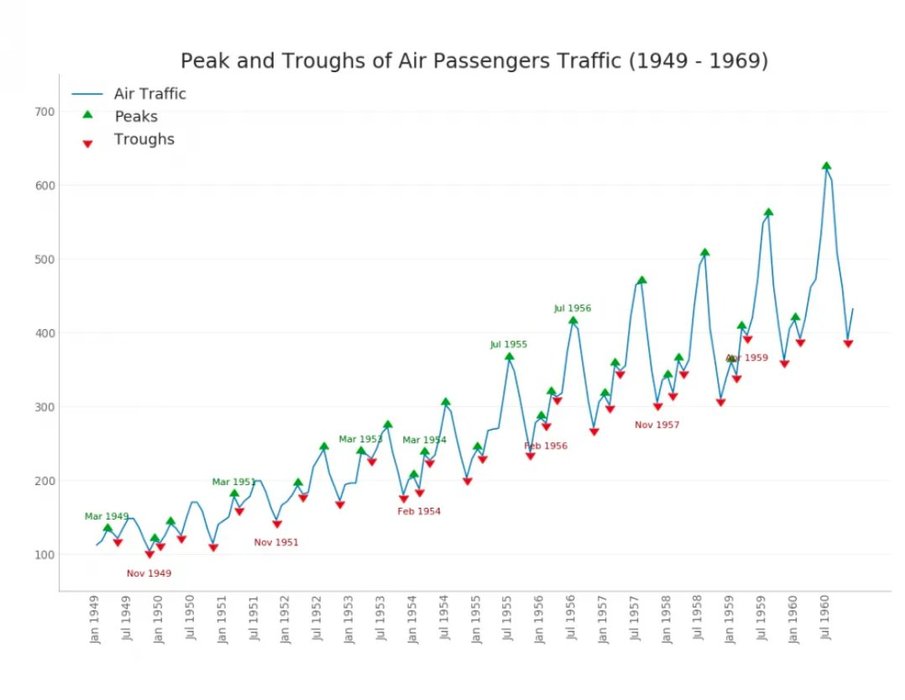
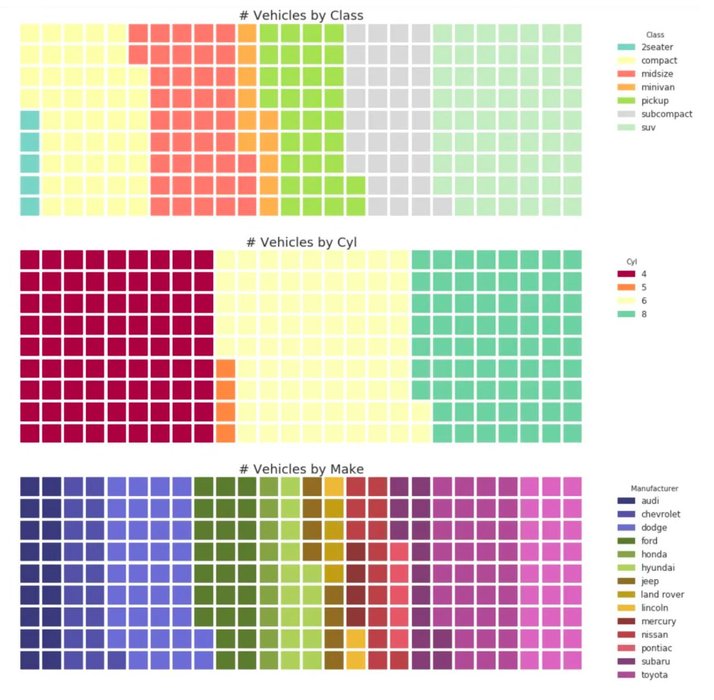
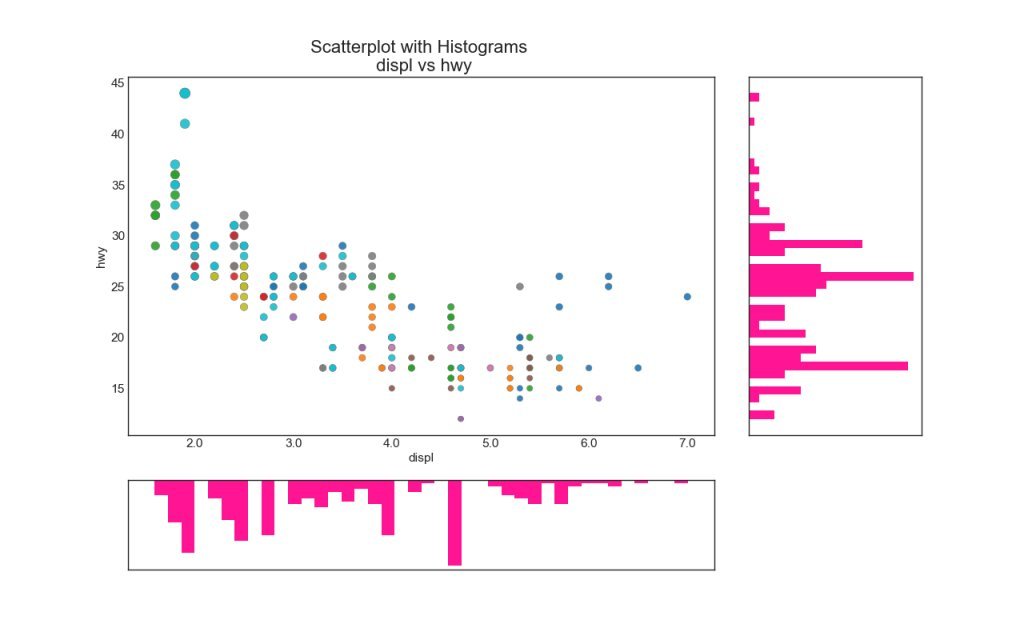
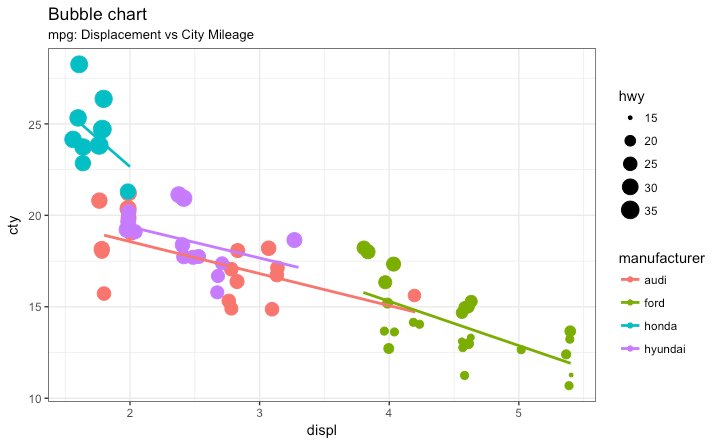
Top 50 Visualization Plots in Matplotlib and ggplot2
Correlation · Deviation · Ranking · Distribution · Composition · Change · Groups
Matplotlib https://t.co/7gPYeuCwOJ
ggplot2 https://t.co/XV3P8mbp4h https://t.co/N2YaQ1Mw3T
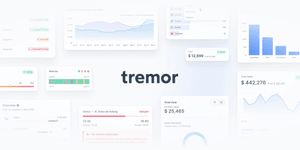
Tremor – Copy-and-Paste Tailwind CSS UI Components for Charts and Dashboards
tremor.so