Sublime
An inspiration engine for ideas

Here's a wild time series package in Python:
Let me introduce you to Stumpy: https://t.co/gw089BZHaA
Nathan McLean
@nathanmclean


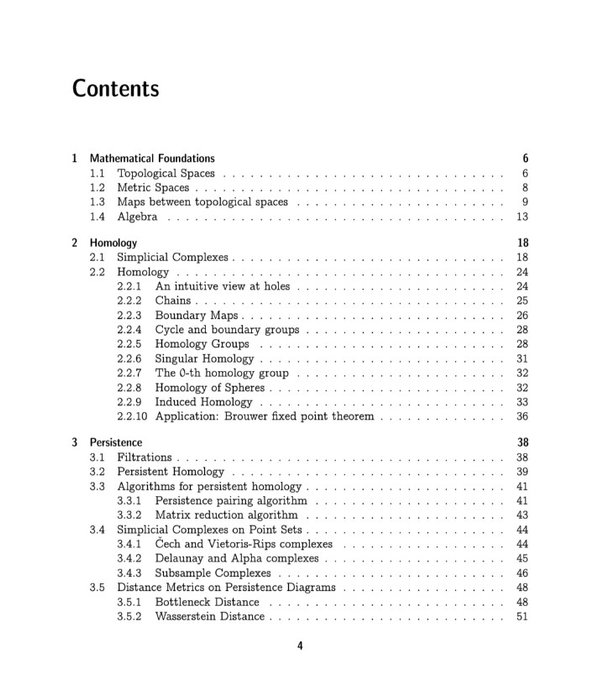

Introduction to Topological Data Analysis by Patrick Schnider
https://t.co/LtuI4n71mE https://t.co/JPz7sh62uO

Data Visualisation
Matt Mower • 13 cards
PyFlux
PyFlux is an open source time series library for Python. The library has a good array of modern time series models, as well as a flexible array of inference options (frequentist and Bayesian) that can be applied to these models. By combining breadth of models with breadth of inference, PyFlux allows for a probabilistic approach to time... See more
PyFlux is an open source time series library for Python. The library has a good array of modern time series models, as well as a flexible array of inference options (frequentist and Bayesian) that can be applied to these models. By combining breadth of models with breadth of inference, PyFlux allows for a probabilistic approach to time... See more