Sublime
An inspiration engine for ideas

3D graphs visualization using https://t.co/B95RPZtZOu
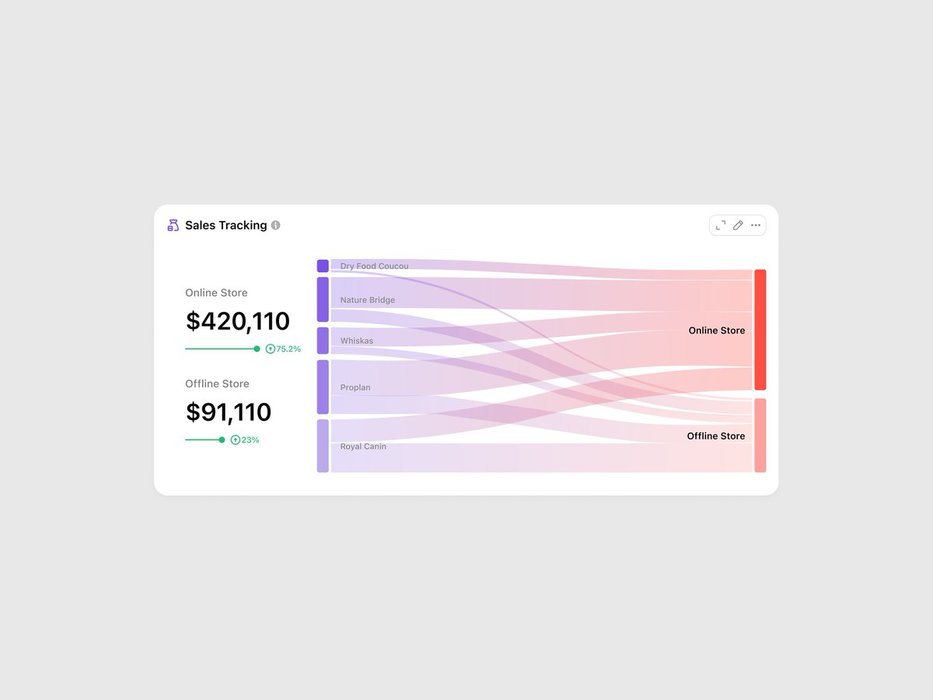
Ain't it nice if all dashboards show graphs this way? https://t.co/NBI4iXNSUr
Melvin Vivasx.com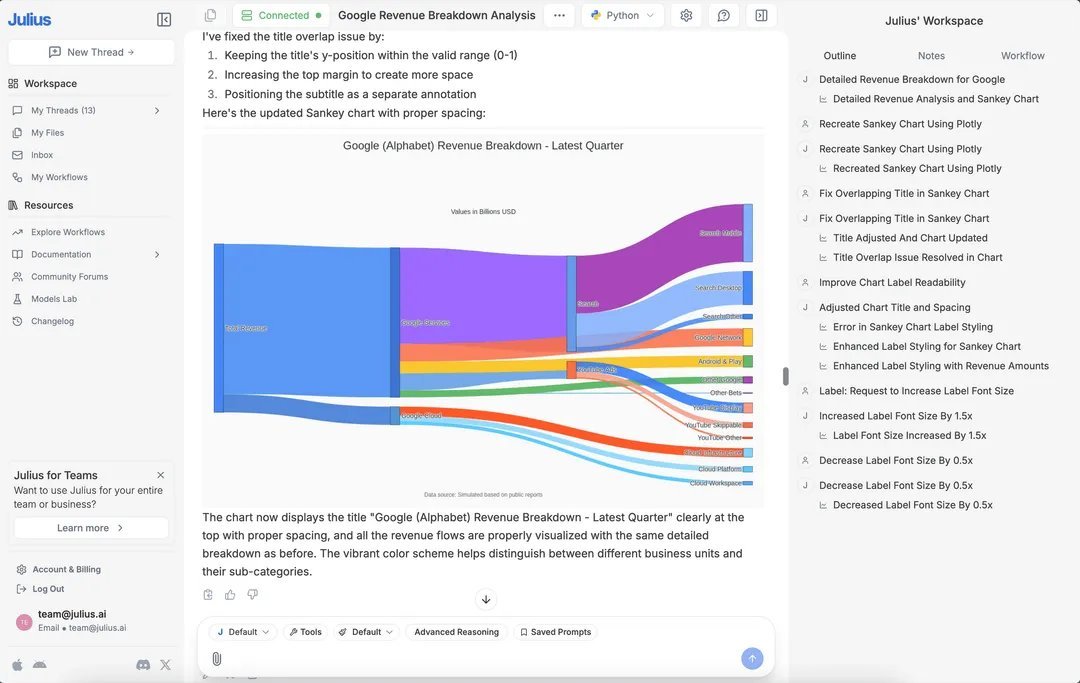
RIP Tableau and PowerBI.
Enter Julius AI.
This is what Julius can do: https://t.co/nuLdz6RI7S


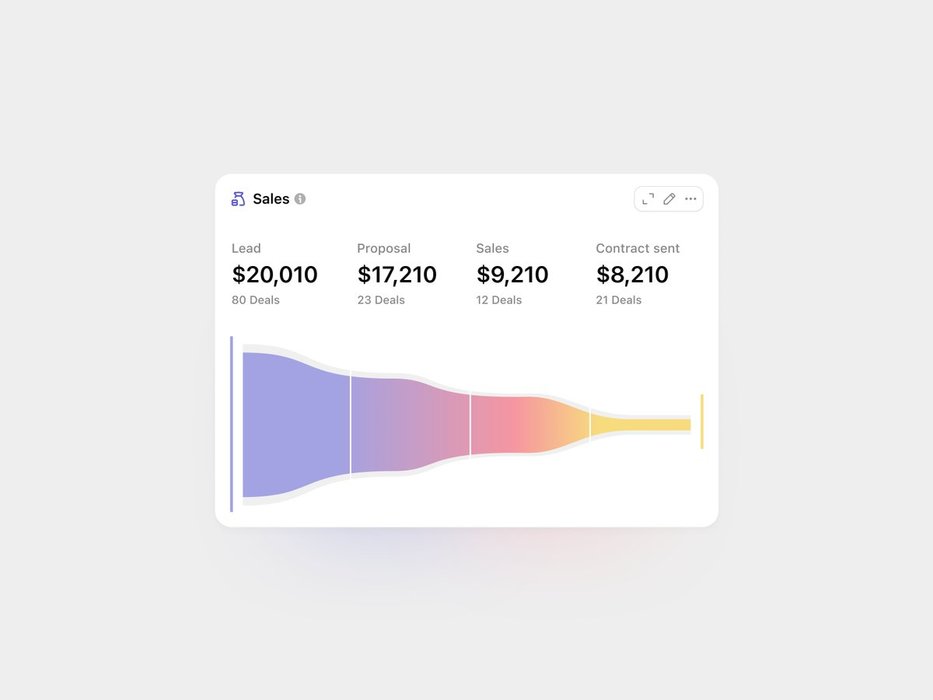
A Free Curated Collection of Over 90 Chart Types
To see the completed Fikri Chart, check the link below 👇 https://t.co/zjQanI5FgL

