Sublime
An inspiration engine for ideas
maps
Jaime • 1 card
racial cartography
Jess Martinaitis • 6 cards
maps
Jaime • 1 card
Again, the map: Is it necessary? Perhaps. In this case, the geographical location of the regions may be relevant, as it shows that unemployment is getting worse in the southeast of Spain.
Alberto Cairo • The Functional Art: An introduction to information graphics and visualization (Voices That Matter)
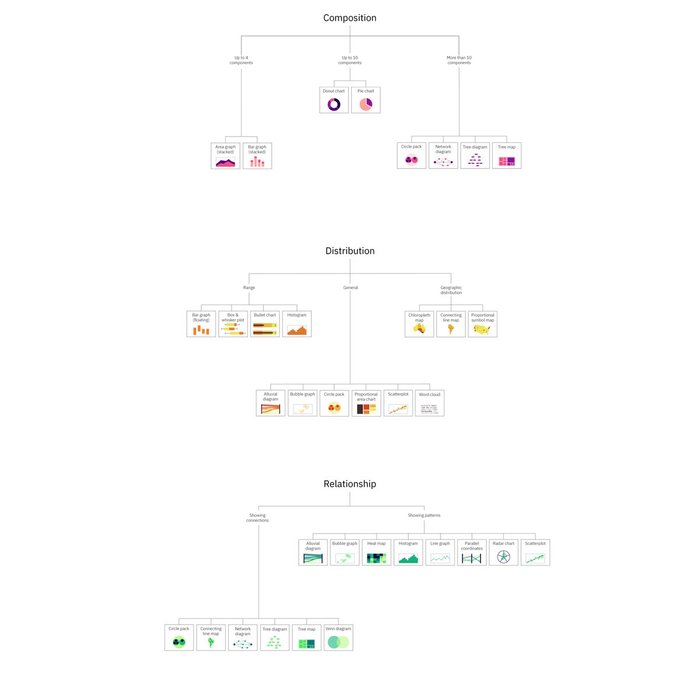
💎 Data visualization decision tree
It will help you choose the right type of data, depending on the message you want to communicate and the nature of your data https://t.co/Pu6u6Na7a0

Visual
Faizan Munir Khan Rajput • 2 cards